Energy Insights: Navigating Costs, Comfort, and Consumption in the Modern Home
The analysis links measured data from Stromfee monitoring: temperatures from 10.2°C to 21.6°C, a peak load of up to 15.6 kW. Such patterns form the basis for temperature- and load-driven energy management.
Hey everyone! 🌟 Today, let’s dive into the world of energy with some cool insights from recent energy metrics that might just help you optimize your own energy use! 🏡💡
### 1. How Much Are We Really Spending on Energy?
You know those fluctuations in your energy bill? Our data shows energy costs swinging from €25.4 up to €180! 😮 Currently, we’re sitting at a comfy €66.3, but keeping an eye on what causes these swings could really help us manage costs better!
### 2. Is It Just Me or Is It Getting Chilly In Here?
As we’re moving into sweater weather 🍂, the data points out a drop from a cozy 21.6°C to a crisp 10.2°C lately. Understanding these trends could help us figure out the best times to turn up the heat or layer up instead!
### 3. What’s Up with Our Home Energy Consumption?
From a hearty 15.6 kW down to a lean 3.01 kW, our homes are becoming real energy-saving champs! 🏆 Let’s keep pushing for ways to make our spaces more energy-efficient as we adapt to different seasons and their demands.
### 4. Checking In On Our Solar Side
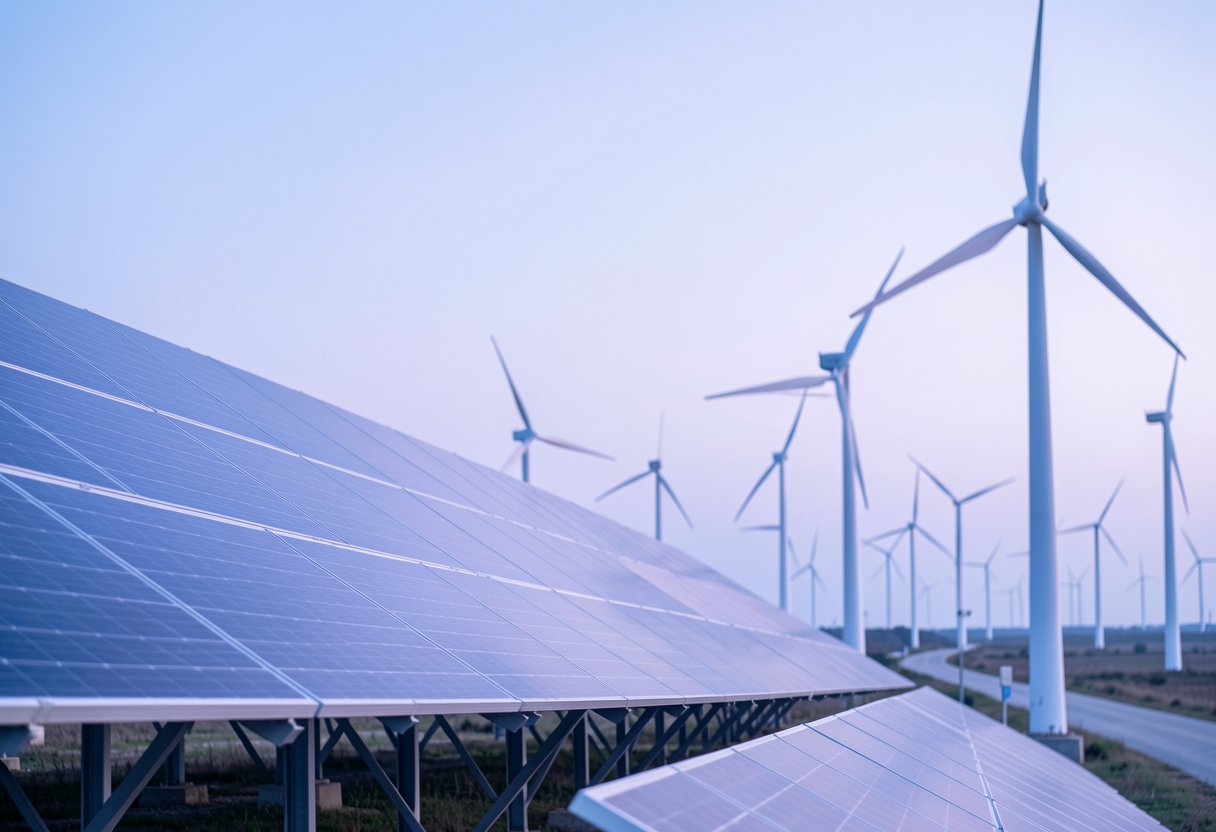
Our Photovoltaic (PV) systems are acting a bit shy lately—currently, they’re absorbing energy instead of soaking up those rays 🌞. We’ll need to dig into this a bit more to make sure our green tech is working at its best!
### 5. Battery Buzz: What’s the Deal?
Though capable of hitting a high of 14.6 kW, our batteries are chilling around the 53.8 W mark. It looks like they’re not working as hard as they could be, which could mean it’s time to check in on maintenance or optimization.
### 6. Power Flow: The Ups and Downs
Ever notice how some days feel like a power feast and others more like a famine? We’ve seen peaks of high energy usage and lows where we barely skim by. Pinpointing these could really help us balance the grid and our bills!
### Wrapping It Up!
All these nuggets from our energy analysis point us towards smarter, more sustainable living. By keeping an eye on how and when we use energy, we can make strides in both saving money and keeping our planet happy. Let’s keep this energy journey eco-friendly and cost-effective! 🌍💚
—
Let’s dive deeper and stay connected as we navigate the evolving energy landscape together! Keep the conversation going and share how you’ve been managing or optimizing your energy consumption. We’re all in this together! 🌟