Energy Insights: Mastering Comfort and Efficiency in Real-Time
The analysis links measured data from Stromfee monitoring: temperatures from 19.9 °C to 23.3 °C, a peak load of up to 0 kW. Such patterns form the basis for temperature- and load-driven energy management.
Hey everyone! 🌟 Let’s dive into some cool insights from our latest energy management data. Trust me, it’s more exciting than it sounds!
🌡️ Keeping It Cool: Temperature Consistency
Did you know? Our latest charts show room temperatures chilling steadily between 19.9 °C to 22 °C. This means our climate control is top-notch, keeping things comfy without a hitch. Go, team!
⚡ Power Play: Energy Consumption Trends
Zooming into our energy use, we average around 601 W. But here’s where it gets interesting: those spikes during peak times? They’re our cue to maybe think about how we can better manage power when everyone’s on high gear. Time to strategize!
📊 All Rooms Equal: Temperature Showdown
All our monitored rooms are almost identical in temperature, mostly hovering around 22 °C to 23.3 °C. This tight ship we run means our heating or cooling systems are doing their job right. Though, we might peek into a few small differences to keep on top of our game.
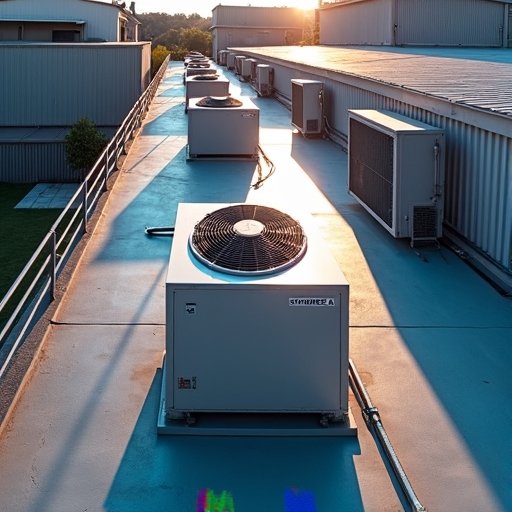
🌀 Tech Spotlight: Mitsubishi Compressor
Our faithful Mitsubishi compressor sticks to an average consumption of 69.7 W. Although it’s steady, those occasional changes in power output deserve a closer look to keep our operations smooth and efficient.
🌞 Solar Quest: A Boost for Sustainability
Here’s a twist – our solar panels logged 0 kW recently. Looks like either a cloudy day or a hiccup in the system. We’re on it, making sure our green energy game stays strong!
🔍 Wrapping Up: What We’ve Learned
All in all, our data’s telling us we’re pretty consistent in controlling temperatures and managing energy. But as always, there’s room to grow, especially in optimizing high-demand periods and keeping an eye on our solar setup.
Stay tuned for more updates and keep those positive vibes! ☀️
Frequently Asked Questions
What is the main focus of the Stromfee blog post?
The post dives into insights from recent energy management data, focusing on comfort and efficiency.
Who is the author of this article?
The article is authored by the Stromfee AI Redaktion (editorial team).
What type of organization publishes this content?
Stromfee AI is the publishing organization for this blog post.
Where can readers find more information about Stromfee?
Readers can explore the Stromfee platform, tools, and request a demo via the website.