Biogas Plant Performance: Navigating Energy Efficiency and Operational Insights
The basis is measured power time series of a biogas/CHP plant — from fermenter and mixer load to electrical output. Such operating data reveals the plant's utilisation, stability and room for optimisation.
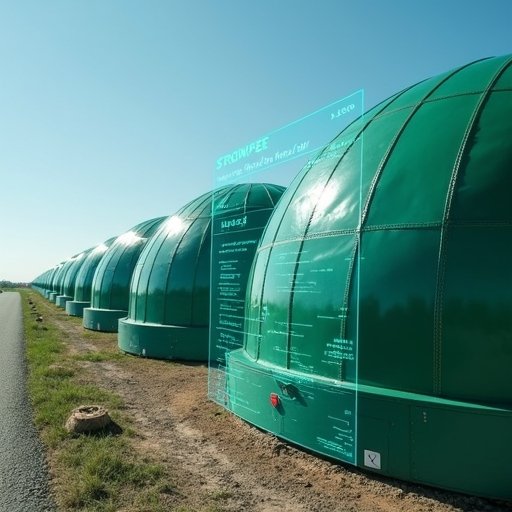
Hey eco-warriors! 🌍✨ We’re diving into some cool insights from our biogas plant’s performance. It’s fascinating how much we can learn from data! 📊💡 Check this out:
1. Power Play: Our plant’s power consumption swings throughout the day, peaking at 93.3 kW. It shows us how energy needs change, which is super interesting! #EnergyInsights
2. Pump It Up: Noticed something quirky with our slurry pump – it hit 0 W and even dipped to -24.0 W! Yep, definitely needs a check-up. #PumpPerformance
3. Dosing the Right Amount: Our dosing system is kinda like the heart of the operation. Lately, it’s been a bit off with fluctuations. Time for a tune-up! #SystemCheck
4. Fermenter Facts:
– RW 1 is steady, but there are some dips we’re keeping an eye on. 🧐
– RW 2 shows a stable pattern, but could we do better? Let’s find out!
– RW 3 has its moments too, dipping into the negatives which is a head-scratcher. #FermentingEfficiency
5. Digester Details:
– RW 1 & RW 2 show good runs but watch out for those occasional drops to 0 W. A sign we might need a pause or tweak here and there. #DigestThis
6. Storage Scoop: Our substrate storage isn’t as consistent as we’d like – hello, big swings in energy use! It’s crucial for our biogas production so we’re on it. #EnergyManagement
Stay tuned for more updates as we fine-tune our way to greener days! Follow us for the lowdown on how we’re making renewable energy a big win. 🌱💪


